February 2018 San Diego Real Estate Market Trends
(SanDiegoRealEstateBuzz) – Considering buying or selling a home in San Diego? The local real estate market offers plenty of opportunity for home sellers and buyers alike as we roll into 2018. As is typical for the winter months, the market slowed slightly into the new year, but certain key indicators are again on the uptick, indicators of a strong market. Let's take a closer look at market conditions in February 2018.
San Diego Real Estate Market Statistics for February 2018
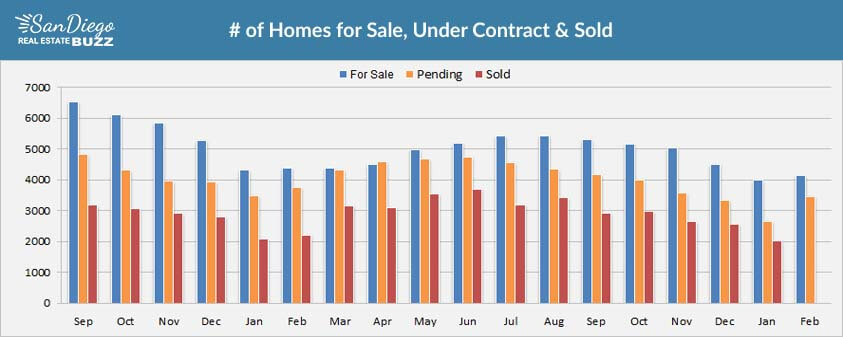
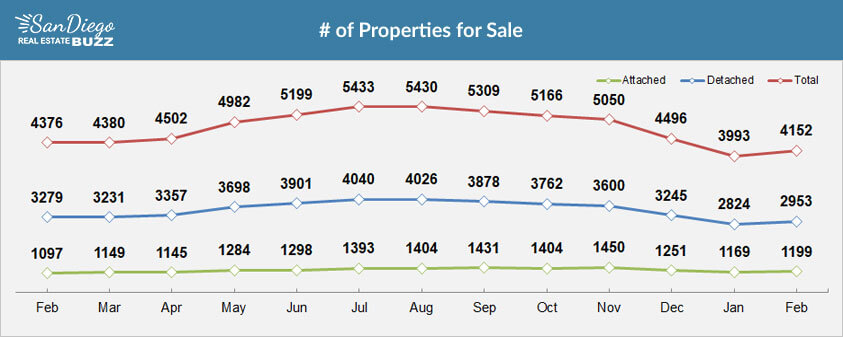
Inventory: Homes for Sale
It's a buyer's market in San Diego this winter, as indicated by the increasing inventory of homes. The total number of available properties grew from 3,993 to 4,152 from January to February, a 4 percent increase. Detached homes for sale saw the most significant increase at a 4.5 percent rise month over month, from 2,824 available homes in January to 2,953 available homes in February. Attached home inventory experienced slightly less growth over the same period, with 1,169 homes for sale in January as compared to 1,199 homes for sale in February, or an increase of just 2.5 percent.
Looking at these numbers year over year, we see that there were 4,376 homes available in February 2017, representing a 5 percent decrease in inventory.
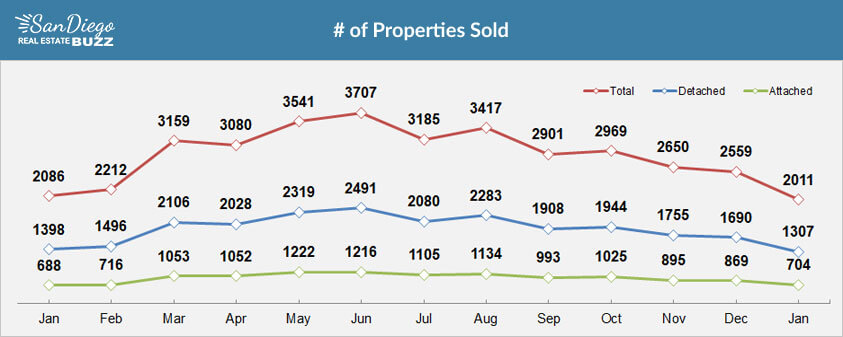
Homes Sold in January
In January 2018, the number of homes sold in San Diego dropped by 21 percent, with total sales decreasing from 2,559 sold in December to 2,011 sold in January. This is the most significant drop we've seen in several months, but keep in mind that the market historically experiences slowing during this time of year. The number of detached homes decreased by almost 23 percent, from 1,690 sold in December to 1,307 in January, while the number of attached homes sold decreased by almost 19 percent, from 869 sold in December to 704 in January.
In January 2017, a total of 1,982 homes were sold, a decrease of less than 1.5 percent. These numbers reflect the market's overall stability.
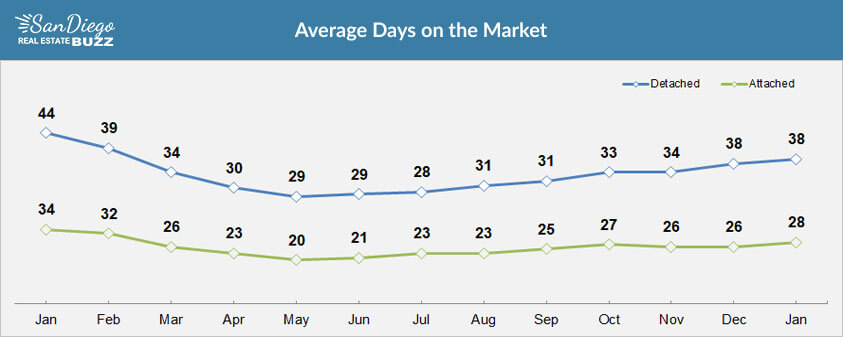
Detached homes remained on the market for an average of 38 days in January; this average did not change month to month. Attached homes spent just two days more on the market on average, a change of almost 8 percent from the previous month. Looking back to January 2017, detached homes showed an average of 43 days on the market, a difference of over 11 percent year over year. Attached homes spent 24 percent longer on the market in January 2017, or an average of 34 days.
San Diego Home Prices: Mixed Results
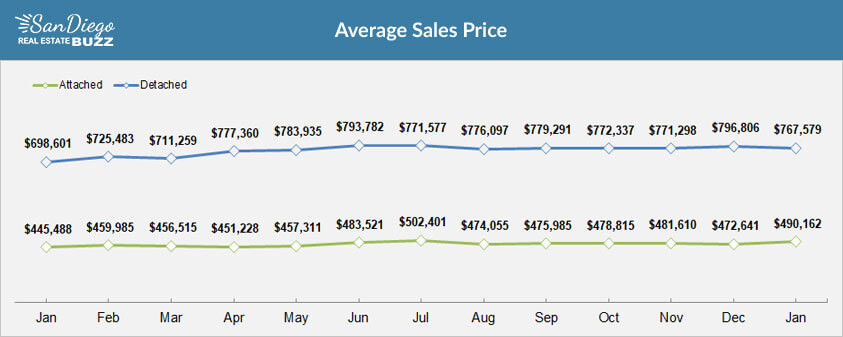
Average sale prices fluctuated slightly from December to January, with detached homes showing a 3.6 percent drop, from $796,806 to $767,579. Attached homes' average sales price rose by 3.7 percent during the same time period, increasing from $472,641 to $490,162.
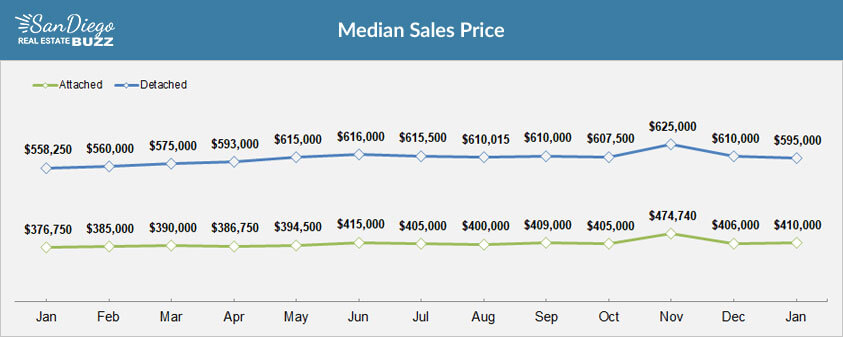
Median sales prices showed similar patterns, with detached homes dropping by 2.45 percent, from $610,000 in December to $595,000 in January. Attached homes' median sales prices rose month to month, from $406,000 to $410,000, or a .98 percent increase.
Looking back to January 2017, we see a median sales price of $560,000 for detached homes, an increase of 6.25 percent year over year. Attached homes had a median sales price of $380,000 in January 2017, and increased by 7.9 percent year over year.
Interest Rates: On the Rise
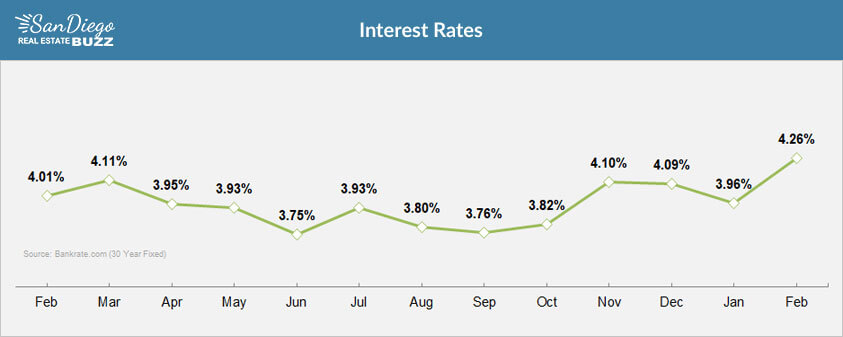
Interest rates jumped by more than 7.5 percent from January to February this year, reflecting the largest increase we've seen in many months. This represents a 6.2 increase over February 2017, when the interest rate was 4.01 percent. Many experts predict that we'll continue to see interest rates rise throughout 2018, so this month may herald the start of a trend toward increasing rates.
0 Comments
Comments