January 2018 San Diego Real Estate Market Trends
(SanDiegoRealEstateBuzz) – Welcome to 2018! We hope you had an enjoyable and relaxing holiday season. Let's start the new year by taking a look at San Diego real estate market trends for December, 2017. During the last month of the year, the market slowed a bit, as is typical for the late fall and winter. However, the overall market continued to offer plenty of opportunities for home sellers, as well as for those seeking San Diego homes for sale.
San Diego Real Estate Market Statistics for January 2018
Homes Sold in December
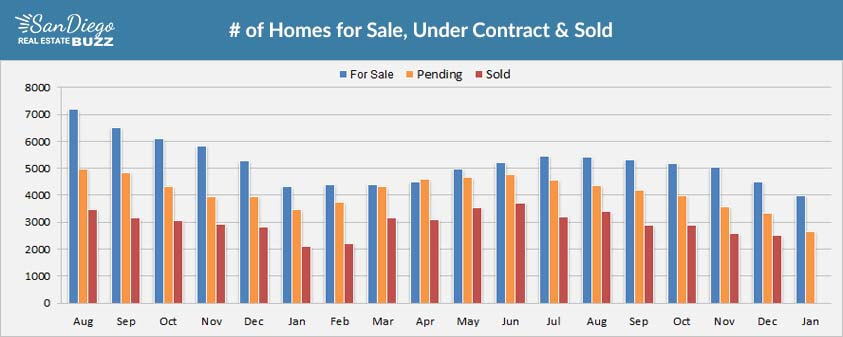
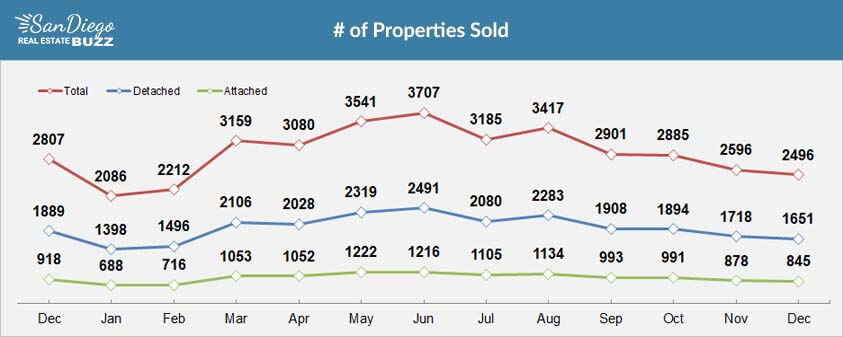
December 2017 brought a slowdown in the number of homes sold month-over-month, but the good news is that this decrease was relatively minimal. Overall, total sales of San Diego homes fell by just 3.85 percent, from 2,596 in November to 2,496 in December. Detached home sales decreased by 3.89 percent, from 1,718 sold in November to 1,651 sold in December, while attached home sales dropped by just 3.75 percent from 878 to 845. For comparison, 2,757 attached and 1,820 detached homes were sold in December 2016.
Inventory: Homes for Sale in January 2018
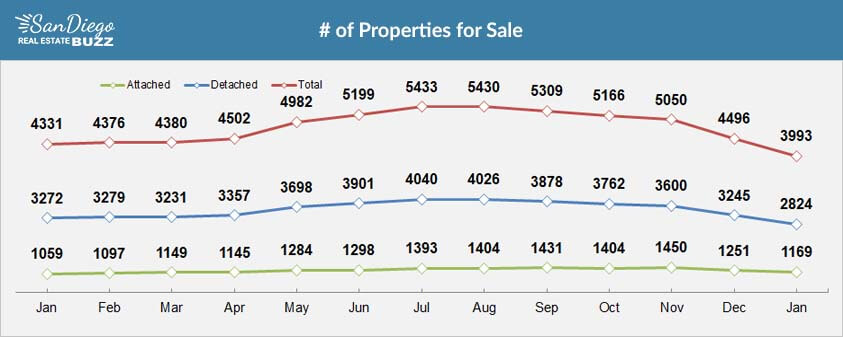
In January 2018, there were 3,393 properties available on the San Diego market; this represents a decrease of 11 percent month-over-month, as there were 4,496 homes on the market in December 2017. Of these, the number of available detached homes decreased by 13 percent, falling from an inventory of 3,245 in December to 2,824 in January. The number of available attached homes decreased by 6.5 percent over the same time period, decreasing from 1,252 to 1,169. Last December, there were 5,279 total homes for sale, a difference of almost 15 percent.
Days on the Market: Holding Steady Over Time
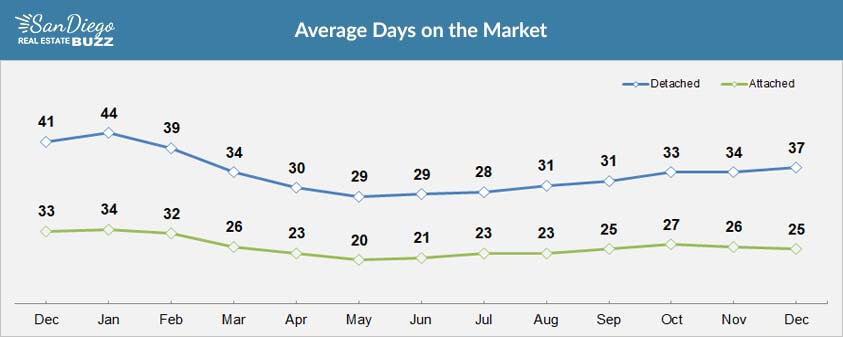
As for the average days spent on the market, detached homes saw a three-day increase from November to December, increasing from an average of 34 days to 37 days, a difference of almost 9 percent. Attached homes, however, spent less time on the market, dropping from an average of 26 days in November to 25 days in December, a 4 percent drop. These numbers haven't moved much since December 2016, when detached homes spent an average of 37 days on the market and attached homes spent 29 days.
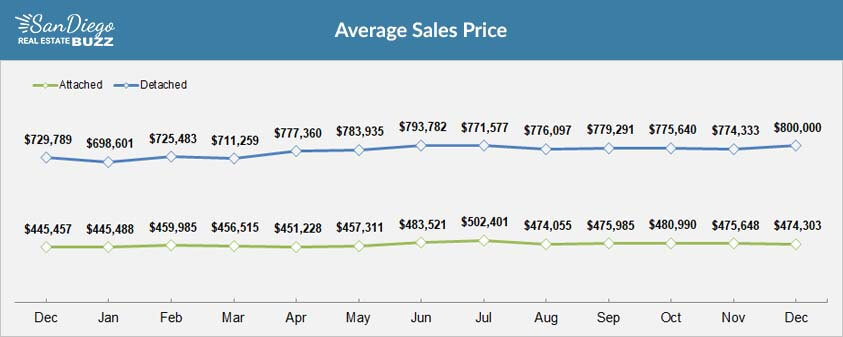
San Diego Home Prices: No Surprises
Home prices held steady month-to-month, with no evident surprises. The average sales price of a detached home rose by just over 3 percent, from $774,333 in November to $800,000 in December. Attached home average sales prices decreased slightly, from $475,648 in November to $474,303 in December, a difference of just .28 percent.
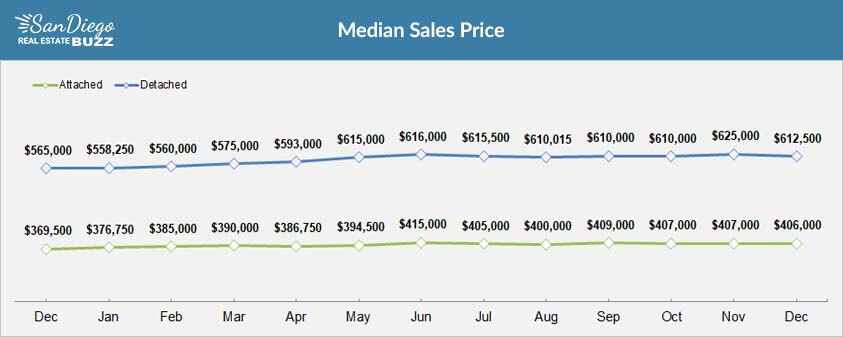
As for median sales prices, detached homes decreased by 2 percent during the last two months of 2017, from $625,000 to $612,500. In 2016, the median sales prices of a detached home was $562,750, an increase of almost 9 percent. The median price of an attached home in December 2017 was $406,000, a decrease of less than .25 percent from November's median price of $407,000. In December 2016, the median price of an attached home was $374,000, representing an 8.8 percent difference.
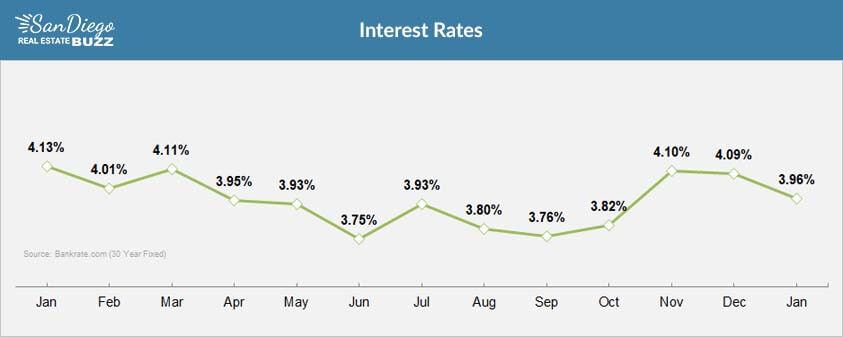
Interest Rates: Slight Drop
Interest rates decreased slightly from December to January, dropping by 3 percent from 4.09 percent to 3.96 percent, reflecting the gradually decreasing trend we've seen since November. In 2016, the same time period, the interest rate was 3.99 percent.
0 Comments
Comments